The Sustainability Scorecard

“Introduction of the new Sustainability & Innovation Scorecard 2026–2028 translates our ESG commitments and innovation priorities into measurable and traceable targets, embedded in corporate decision-making. In an increasingly sustainability-led market, the adoption of clear ESG targets strengthens our position as an industry leader and pioneer.”

Maria Cristina Bifulco

Chief Strategy, IR, M&A and Communication Officer

Setting clear, measurable objectives and continually tracking the progress made are fundamental steps in crafting a credible roadmap towards sustainability. Our Sustainability Scorecard establishes a tangible action plan for integrating social, economic and environmental impacts into business and decision-making processes.

Prysmian’s Sustainability Impact Scorecard 2023-2025

To provide a credible path to sustainability and give substance to the long-term commitments assumed, Prysmian has set clear, measurable short-term goals, with progress monitored annually via the three-year Impact Scorecard 2023–2025 (2022 baseline). This includes 12 impact KPIs designed to strengthen measurement, monitoring and disclosure of the results achieved.

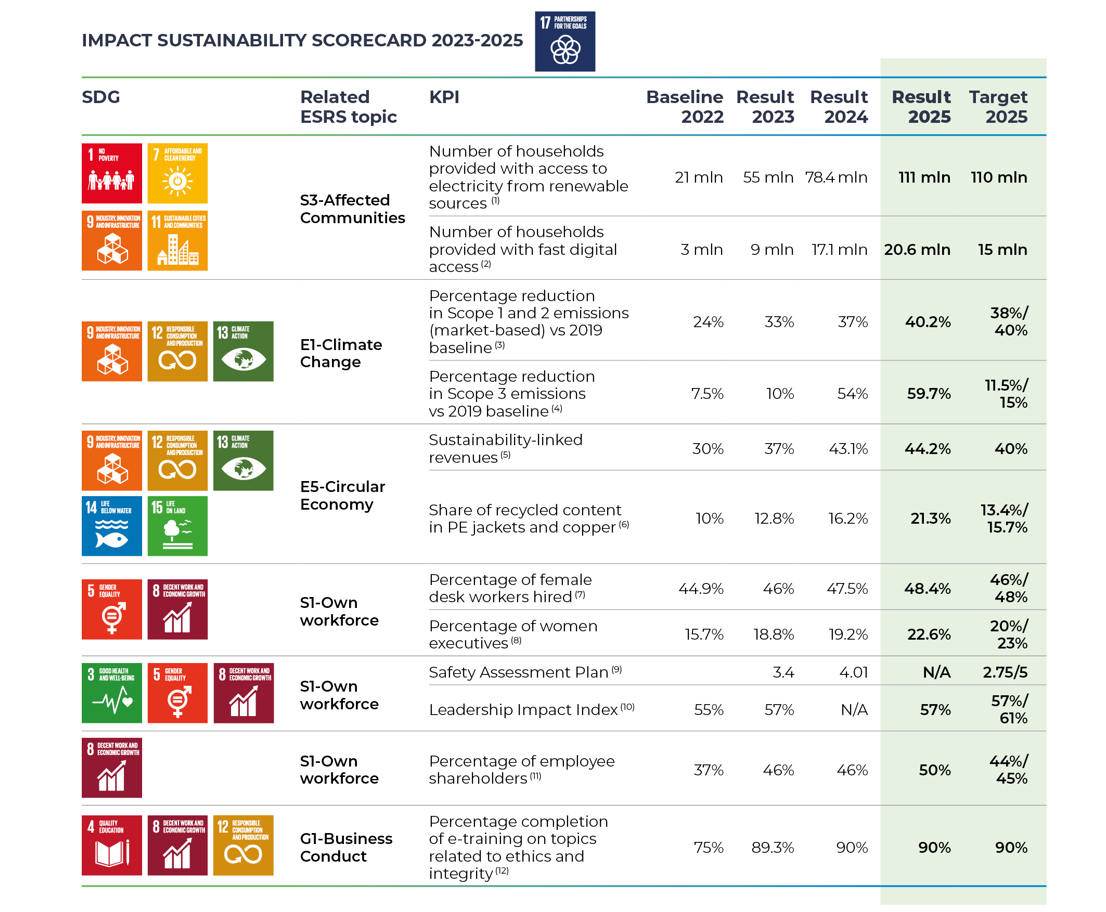
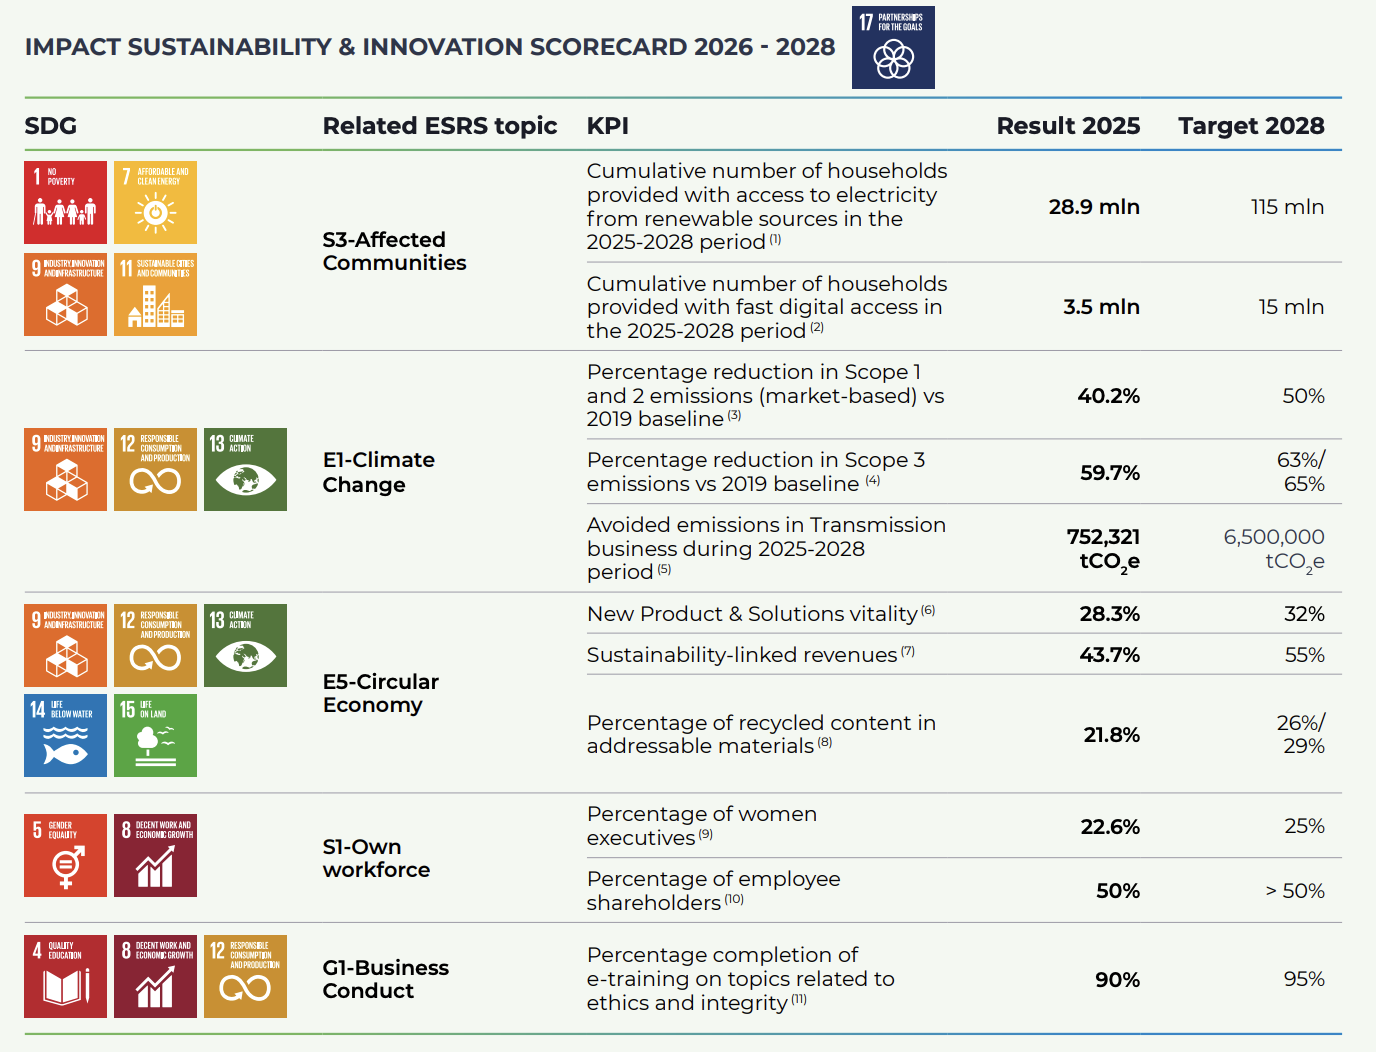
(1) Number of households provided with access to electricity from renewable sources: Estimated number of households connected to renewable energy through Prysmian products. This includes installed capacity through photovoltaic panels, onshore and offshore wind turbines, and interconnections associated with renewable energy production.
(2) Number of households provided with fast digital access: Estimated number of households with fast digital access (defined as FTTH, FTTB, DOCSIS 3.0) thanks to Prysmian products.
(3) Percentage reduction in GHG emissions (market-based Scope 1 and 2) vs 2019 baseline: Reduction in GHG emissions linked to operational sites (Scope 1 and 2) versus 2019, in line with SBTi target. Scope 2 is calculated using a Market-based method.
(4) Percentage reduction in Scope 3 emissions vs 2019 baseline: Reduction in GHG emissions linked to the upstream and downstream value chain (Scope 3) versus 2019, in line with the SBTi target.
(5) Sustainability-linked revenues: Percentage of total revenues generated by products and solutions with a net positive environmental impact, or a reduced negative environmental impact compared with industry standards. Sustainability-linked revenues, as defined in the OI-R&D-CD-002 operating procedure, are revenues from products and solutions that meet E Path, E3X, Green Overhead Lines, Green Al Rod & Strip, Sicco and Transmission BU criteria. The figure of 44.2% is calculated excluding Channel; including this entity in the scope (in the denominator) the KPI is 43.7%.
(6) Share of recycled content in PE jackets and copper: Percentage by weight of recycled content in certain materials purchased. The scope of the indicator includes 1) copper purchased at Group level, excluding occasional suppliers and semi-finished products and 2) polyethylene used for cable jackets, excluding applications for which customers do not allow the use of secondary materials.
(7) Percentage of female desk workers hired: Share of women desk workers on permanent contracts out of the total number of desk workers on permanent contracts. This indicator includes all desk workers hired externally (including recruitment programs) and all conversions from agency/fixed-term to permanent contracts.
(8) Percentage of women executives: Women executives (job grade 20 and above) as a share of the total number of executive employees. Job grades of 20 and over refer to the most senior management and leadership positions within the organization. This generally regards key management personnel with broad responsibility for decision-making and resource management and a significant impact on the entity’s financial, social and environmental performance. These management grades make a decisive contribution to defining the entity’s policies and governance and to implementing sustainability goals. The KPI demonstrates the Group’s ability to both promote people to leadership roles from within the organization and to hire them in the market, in addition to its ability to retain talent.
(9) Safety Assessment Plan: This indicator scores the Group’s various plants based on the maturity of their safety management systems, calculated following an audit conducted by a specialist external company. The indicator consists of four categories with different weightings (governance, employee engagement, risk assessments, injury frequency rate). At the end of the audit, an overall score is assigned on a scale of 1 (minimum) to 5 (maximum). From 2025, this figure is no longer reported, as the previous KPI has been replaced by the “severity rate”, an indicator deemed to better reflect safety levels in Prysmian’s plants. This decision reflects the desire to focus on reducing the most serious injuries, taking a broader view rather than focusing only on the total number of injuries.
(10) Leadership Impact Index: Index calculated as the percentage of employees who declared a level of engagement with the company of at least 5 out of 7 points in the Speak Up survey conducted by the Company.
(11) Percentage of employee shareholders: Number of employees who hold Prysmian shares held in the Company’s administrative accounts through the GROW, YES and BE IN plans as at December 31, divided by the total number of employees eligible to participate in at least one of the plans.
(12) Percentage completion of e-training on topics related to ethics and integrity: Includes e-learning conducted through the Group’s business management system and is for all desk workers (excluding business partners, consultants, contractors, employees on leave of 30 days or more and trainees on fixed-term contracts). It is subject to annual approval of the compliance plan by the Board of Directors. Topics may include one or more of the following: code of ethics, anti-corruption, gifts, conflicts of interest, Helpline or commercial policy.

The new Sustainability & Innovation Scorecard 2026–2028

From 2026, Prysmian will introduce a new Sustainability & Innovation Scorecard 2026–2028, an impact scorecard covering a three-year period with a 2025 baseline and targets set for 2028. The new scorecard translates ESG commitments and innovation priorities into measurable, monitorable goals that can be integrated into decision-making processes.

Alongside established indicators, the new Scorecard introduces new KPIs focusing on innovation, technology and the development of advanced solutions, measuring performance in terms of human capital, governance and the Group’s ability to lead the energy and digital transition.


(1) Cumulative number of households provided with access to electricity from renewable sources in the 2025–2028 period: Cumulative number of households potentially connected to renewable energy through Prysmian products and solutions. This includes installed capacity through photovoltaic panels, onshore and offshore wind turbines for use in renewable energy production. Unlike the 2023–2025 scorecard, in the 2026–2028 scorecard, the method of calculation has been revised by inputting data from the International Energy Agency (IEA) recalibrated with Prysmian’s market share; this has resulted in a slight change in the result for 2025.
(2) Cumulative number of households provided with fast digital access in the 2025–2028 period: Cumulative number of households with access to fast digital access (defined as FTTH, FTTB, DOCSIS 3.0) thanks to Prysmian products and solutions.
(3) Percentage reduction in GHG emissions (market-based Scope 1 and 2) vs 2019 baseline: Reduction in GHG emissions linked to operational sites (Scope 1 and 2) versus 2019, in line with the SBTi target. Scope 2 is calculated using a market-based method.
(4) Percentage reduction in Scope 3 emissions vs 2019 baseline: Reduction in GHG emissions linked to the upstream and downstream value chain (Scope 3) versus 2019, in line with the SBTi targets.
(5) Avoided emissions in Transmission business during 2025–2028 period: Emissions avoided thanks to installation of solutions enabling the development of renewable energy by the Transmission business unit, in line with WBSD (World Business Council for Sustainable Development) guidelines.
(6) New Product & Solutions vitality: Turnover generated by sales of new products/solutions as a percentage of total turnover over a time-scale of 3 years, starting from the first customer order. The time-scale for the Transmission BU is 6 years. New products/solutions consist of market-ready products, systems or services that have required a major commitment in terms of R&D in order to be developed and that contain new elements.
(7) Sustainability-linked revenues: Percentage of total revenues generated by products and solutions with a net positive environmental impact, or a reduced negative environmental impact compared with industry standards. Sustainability-linked revenues, as defined in the OI-R&D-CD-002 operating procedure, are revenues from products and solutions that meet E Path, E3X, Green Overhead Lines, Green Al Rod & Strip, Sirocco and Transmission BU criteria. The figure of 43.7% includes the Channel Group.
(8) Percentage of recycled content in addressable materials: Share of recycled content with respect to total purchases of the following materials: copper, PE for jackets, steel and lead. The addressable volume for lead is limited to the market for extruded submarine cable in Transmission BU; the addressable volume for steel is limited to the market for Overhead Lines in North America; the addressable volume for polyethylene is limited to the market for low and medium voltage cables jackets.
(9) Percentage of women executives: Women executives (job grade 20 and above) as a share of the total number of executive employees. Job grades of 20 and over refer to the most senior management and leadership positions within the organization. This generally regards key management personnel with broad responsibility for decision-making and resource management and a significant impact on the entity’s financial, social and environmental performance. These management grades make a decisive contribution to defining the entity’s policies and governance and to implementing sustainability goals. The KPI demonstrates the Group’s ability to both promote people to leadership roles from within the organization and to hire them in the market, in addition to its ability to retain talent.
(10) Percentage of employee shareholders: Number of employees who hold Prysmian shares held in the Company’s administrative accounts through the GROW, YES and BE IN plans as at December 31, divided by the total number of employees eligible to participate in at least one of the plans.
(11) Percentage completion of e-training on topics related to ethics and integrity: Includes e-learning courses on the Code of Ethics, anti-corruption, antitrust issues and the Helpline, conducted through the Group’s business management system and aimed at all at-risk functions.