
Noodle: Predictive Analytics made simple

Traditional analysis tools focus only on the machine — considered to be the main responsible for a certain deviation — and lose sight of the complexity of data intersections, missing key factors that could involve multiple dimensions of the available data.
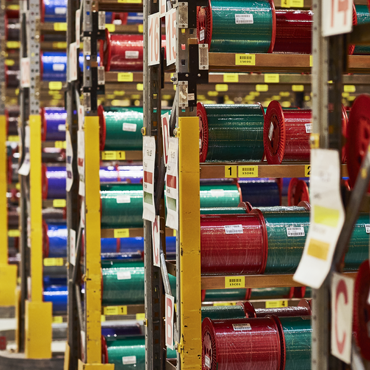
For this reason, the Team at FOS, Prysmian’s optical fibre plant in Italy, joined forces with the Group’s Digital Innovation Lab and Quality Department and collaborated with the Moxoff team to explore the field of Predictive Quality Analytics and new state-of-the-art models for analysing big data.
And this is how Noodle has become a reality.
What is Noodle?
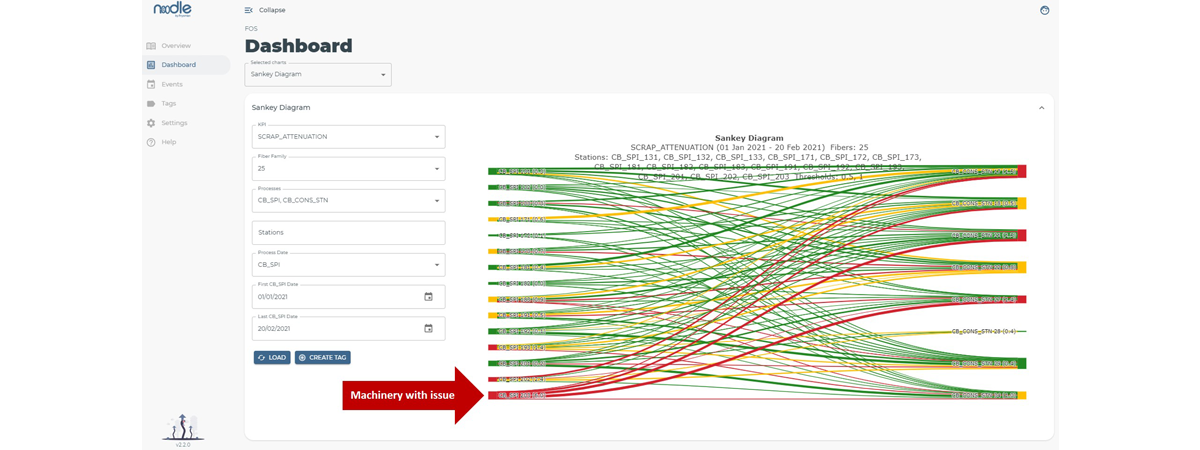
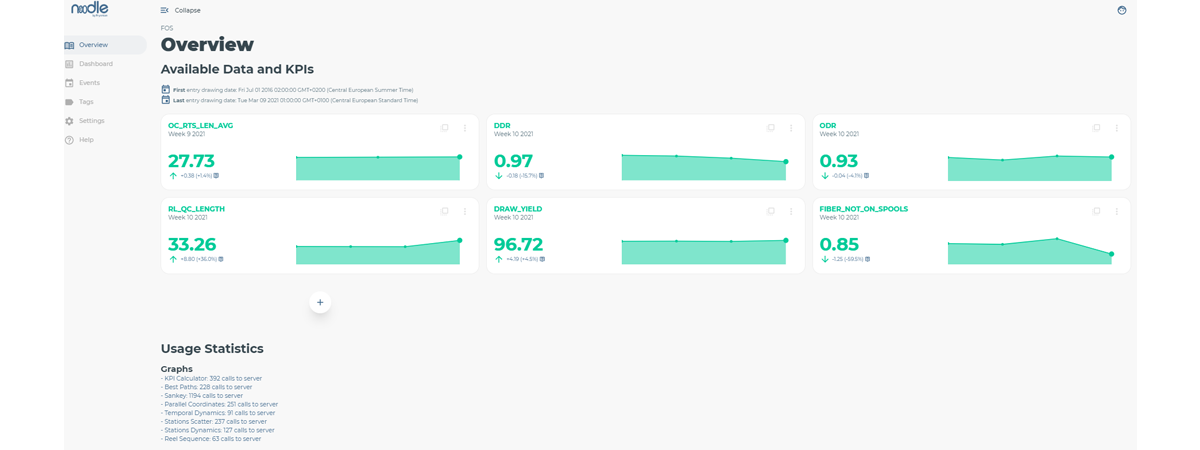
<p style="text-align:justify;"> </p> <p style="text-align:justify; line-height:28px;">Noodle is an <strong>intelligent data visualisation tool</strong> that digests huge amounts of data, structures it in a coherent data model and provides <strong>advanced statistical analysis</strong> and a <strong>graphical easy-to-understand view of process areas and machines</strong> that most significantly impact the performance of the production process.</p>
In this way, it is possible to find out even complex cause-effect relationships between the individual production phases and their KPIs, identifying the machinery that is not performing correctly and acting promptly to find a solution, working towards being able to automatically predict and suggest the corrective actions to put in place in the future.
Since its deployment, Noodle has helped the process engineering team to identify the origin of critical trends and immediately react putting in place counter measures that have promptly gotten the process back in control with no impact on the affected performance KPIs.
Noodle is just starting its journey. Reducing costs and scrap has a positive impact on production and profitability KPIs, while also improving the plant’s sustainability performance. In fact, acting promptly means reducing the production of out-of-specification products, minimising the use of raw materials and energy, keeping production lean and avoiding waste of precious resources.